1
Please refer to important disclosures at the end of this report
1
1
Particulars (` cr)
Q3FY20
Q2FY20
% chg (qoq)
Q3FY19
% chg (yoy)
NII
14,173
13,515
4.9
12,577
12.7
Pre-prov. profit
12,945
11,698
10.7
10,779
20.1
PAT
7,416
6,345
16.9
5,586
32.8
Source: Company
For 3QFY2020, HDFC Bank's PAT surged 33% yoy led by 20% yoy increase in pre-
provision profit and higher other income coupled with tax benefits, which supported
profitability. Loan book continued to grow at 20% yoy supported by wholesale book,
however, NII growth was subdued at 13% (higher balance sheet liquidity). On asset
quality front, headline asset quality remained stable however; slippages and credit
costs remained elevated. Deposits grew at 25% yoy (4.5% qoq) owing to 28.6% yoy
growth in term CA deposit. CASA mix improved 24bps qoq to 39.5% (40.7% in
3QFY2019).
Loan growth strong led by pick up in corporate loan book: Softening of auto loan
segment (contributes 25% of retail loans), which grew 2.3% yoy led to moderate
growth in advances. Credit card and personal loans reported healthy growth of
28.6% yoy and 23.3% yoy, respectively. Wholesale loans grew by 26.6%, while retail
loans moderated to 14.1% yoy. Despite heavy advertisement during festive season,
retail growth remained moderate.
Non-interest income grew strong, cost/income declined: Total other income grew at a
healthy rate of 35.5% yoy led by healthy core fee income. Core fee income grew by
24.1% yoy owing to sustained growth in payment-related fees (~35% of total) and
improvement in fees from third-party products (improvement in yield). The
management said that retail accounts for ~93% of fee income, while treasury gains
and one-off recovery from the resolution of a NCLT matter also supported other
income. From last four quarters, the bank's C/I is consistently in a declining trend,
and for Q3FY2020, CI declined 50bps/87bps on yoy/qoq basis to 37.9% on the
back of 18% yoy growth in operating expenses and revenue growth of 19% yoy.
Management has guided for 300bps decline in C/I over the next 3-5 years.
Asset quality disappoints; slippages, credit costs higher: In absolute terms, GNPA
went up by `919cr, up 7.3% qoq and stood at 1.42%, NPA increased by `677cr, up
17% qoq. The provision coverage ratio for the quarter declined ~300bps to 67%
even after taking ~37% growth in provisions. Gross slippages remained high at
`5,300cr (2.4% annual slippages), this was largely driven by slippages in agriculture
portfolio and one-off corporate slippages. However, core slippages were at 1.7%.
Management gave positive commentary on retail asset quality while sounded a bit
concerned about CV/CE portfolio owing to the weak underlying macro environment.
The credit cost ratio remained high at 1.3%.
Outlook & Valuation: Credit growth beat the industry growth rate driven by strong
retail business. The strong liability franchise and healthy capitalisation provides
earnings visibility. We value HDFC Bank using SOTP method, valuing standalone
banking business at 3.7x of FY2021 ABV and its two subsidiaries at `78/share. We
recommend a Hold on the stock, with a target price of `1,390/ share.
Key Performance
Y/E March (` cr)
FY18
FY19
FY20E
FY21E
FY22E
NII
40,092
48,243
55,893
66,462
79,499
% chg
21.0
20.3
15.9
18.9
19.6
Net profit
17,486
21,078
26,291
31,456
38,101
% chg
20.2
20.5
24.7
19.6
21.1
NIM (%)
4.4
4.4
4.3
4.3
4.3
EPS ( `)
33.8
38.7
48.0
57.4
69.6
P/E (x)
37.3
32.6
26.2
21.9
18.1
P/ABV (x)
6.2
4.8
4.1
3.5
3.1
RoA (%)
1.8
1.8
1.9
1.9
2.0
RoE (%)
18.2
16.8
16.7
17.2
18.0
Source: Company, Angel Research; Note: CMP as of Jan 20, 2019
HOLD
CMP `1,255
Target Price `1,390
Investment Period 12 Months
Stock Info
Sector
Bloomberg Code
Shareholding Pattern (%)
Promoters 21.3
MF / Banks / Indian Fls 17.1
FII / NRIs / OCBs 30.8
Indian Public / Others 12.0
Abs. (%) 3m 1yr 3yr
Sensex 6.6 13.5 53.6
HDFC Bank 1.3 16.9 102.9
Beta
1.1
Banking
Market Cap (` cr)
6,87,312
52 Week High / Low
1306/1011
Avg. Daily Volume
7,32,922
Face Value (`)
1
BSE Sensex
41,529
Nifty
12,225
Reuters Code
HDBK.BO
HDFCB IN
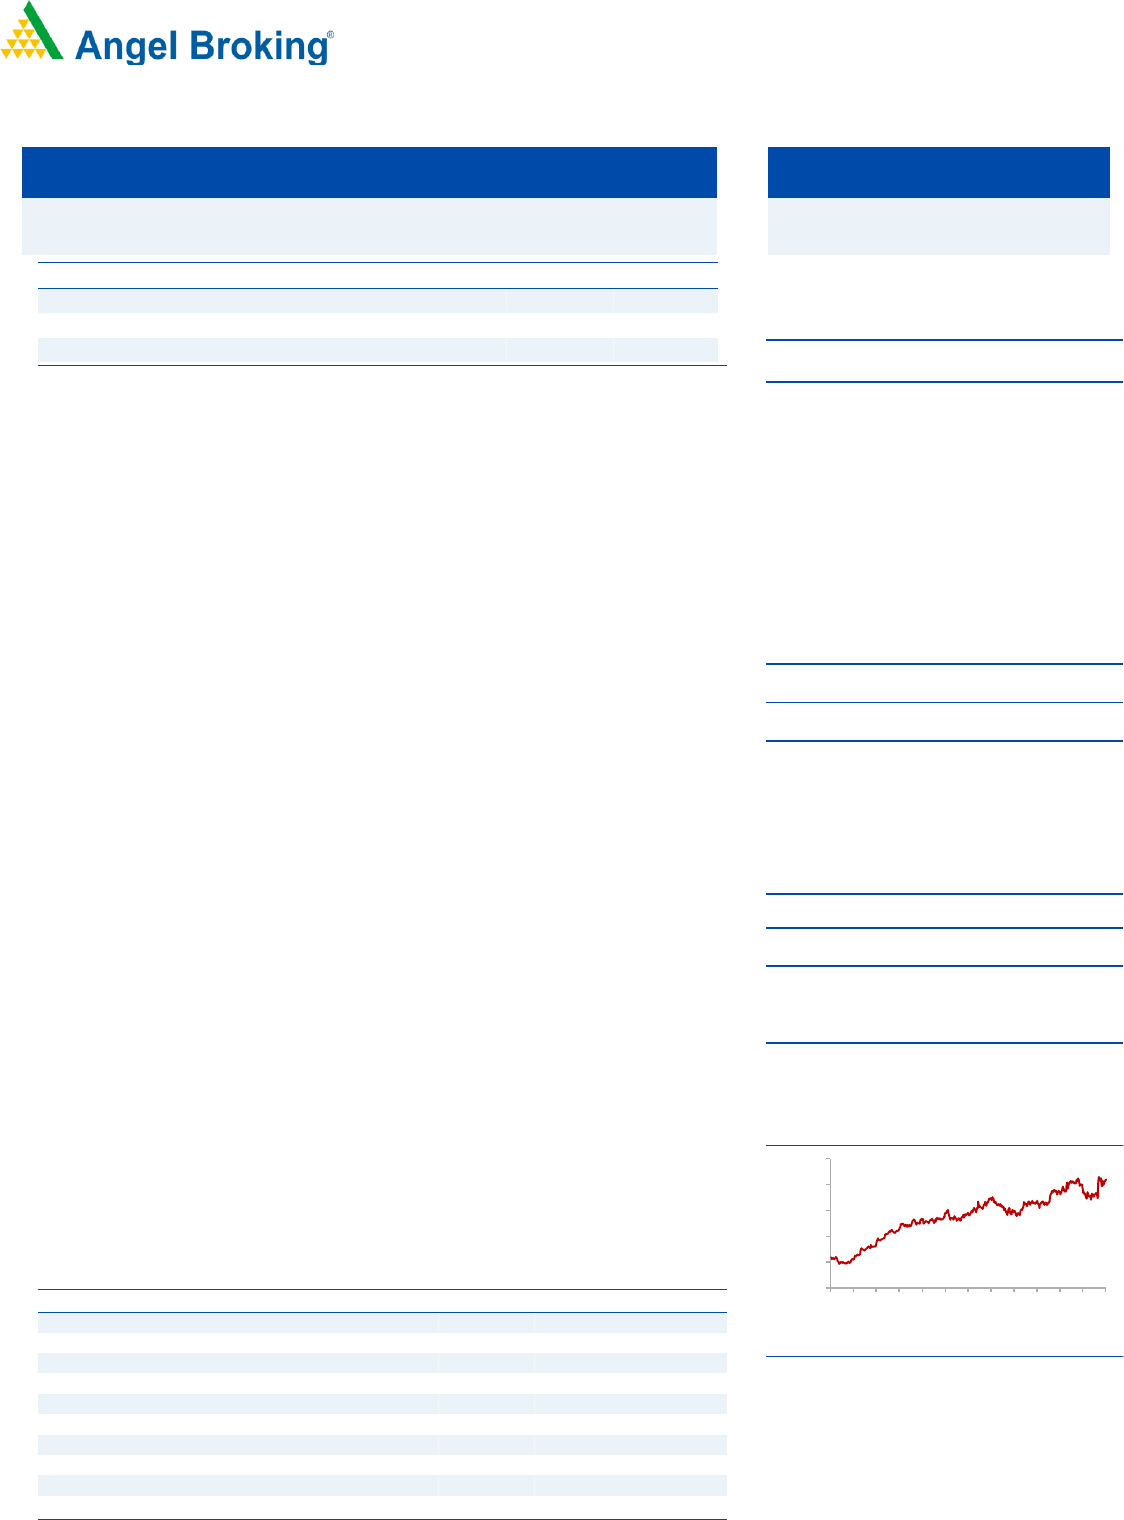
3-Year Price Chart
Source: Company
400
600
800
1000
1200
1400
Oct-16
Jan-17
Apr-17
Jul-17
Oct-17
Jan-18
Apr-18
Jul-18
Oct-18
Jan-19
Apr-19
Jul-19
Oct-19
HDFC Bank
Other income aids top-line; credit costs, slippages elevated
Q3FY2020 Result Update | Banking
Jan 21, 2020
2
HDFC Bank| Q3FY2020 Result Update
Jan 21, 20
2
Exhibit 1: Quarterly Performance
Particulars (` cr)
Q2FY19
Q3FY19
Q4FY19
Q1FY20
Q2FY20
Q3FY20
% YoY
% QoQ
Interest earned
24,200
25,890
26,333
27,392
28,166
29,370
13.4
4.3
- on Advances / Bills
18,828
20,306
21,019
21,805
22,514
23,425
15.4
4.0
- on investments
5,042
5,319
5,047
5,248
5,092
5,203
(2.2)
2.2
- on balance with RBI & others
94
98
112
175
416
608
519.2
46.1
- on others
236
167
155
164
144
134
(19.8)
(7.3)
Interest Expended
12,436
13,314
13,244
14,097
14,651
15,197
14.1
3.7
Net Interest Income
11,763
12,577
13,089
13,294
13,515
14,173
12.7
4.9
Other income
4,016
4,921
4,871
4,970
5,589
6,669
35.5
19.3
- Fee & commission income
3,296
3,647
3,692
3,552
4,055
4,527
24.1
11.6
- Treasury income
(33)
474
229
212
481
677
42.7
40.7
- Forex & derivative income
420
398
403
577
552
526
32.2
(4.7)
Others
333
403
547
630
502
940
133.6
87.3
C/I%
39.9
38.4
39.6
39.0
38.8
37.9
(51.3)bp
(87.7)bp
Operating income
15,779
17,498
17,961
18,264
19,104
20,842
19.1
9.1
Operating expenses
6,299
6,719
7,117
7,117
7,406
7,897
17.5
6.6
- Employee expenses
1,909
1,968
2,074
2,217
2,355
2,455
24.8
4.2
- Other Opex
4,390
4,752
5,043
4,900
5,051
5,442
14.5
7.7
Pre-provision Profit
9,480
10,779
10,844
11,147
11,698
12,945
20.1
10.7
Provisions & Contingencies
1,820
2,212
1,889
2,614
2,701
3,044
37.6
12.7
PBT
7,660
8,567
8,954
8,533
8,998
9,902
15.6
10.1
Provision for Tax
2,654
2,981
3,069
2,965
2,652
2,485
(16.6)
(6.3)
PAT
5,006
5,586
5,885
5,568
6,345
7,416
32.8
16.9
Effective Tax Rate (%)
35
35
34
35
29
25
(969.7)bp
(437.9)bp
Liability Profile
Advance
7,50,838
7,80,951
8,19,401
8,29,730
8,96,984
9,36,030
19.9
4.4
Deposit
8,33,364
8,52,502
9,23,141
9,54,554
10,21,615
10,67,433
25.2
4.5
Term deposit
5,05,418
5,31,943
5,31,943
5,75,553
6,20,379
6,45,606
21.4
4.1
CA
1,15,131
1,11,905
1,42,498
1,25,663
1,36,791
1,43,900
28.6
5.2
SA
2,34,568
2,35,179
2,48,700
2,53,338
2,64,445
2,77,928
18.2
5.1
CASA
3,49,699
3,47,084
3,91,198
3,79,001
4,01,236
4,21,828
21.5
5.1
CASA%
42.0
40.7
42.4
39.7
39.3
39.5
(119.6)bp
24.3bp
CA%
13.8
13.1
15.4
13.2
13.4
13.5
35.4bp
9.1bp
SA%
28.1
27.6
26.9
26.5
25.9
26.0
(155)bp
15.2bp
C/D
90.1
91.6
88.8
86.9
87.8
87.7
(391.7)bp
(11.1)bp
NIM (Reported)%
4.3
4.3
4.4
4.3
4.2
4.2
(10)bp
0bp
Source: Company, Angel Research
3
HDFC Bank| Q3FY2020 Result Update
Jan 21, 20
3
Exhibit 2: Profitability
Profitability Ratios
Q2FY19
Q3FY19
Q4FY19
Q1FY20
Q2FY20
Q3FY20
% YoY
% QoQ
Advance Yield
10.32
10.61
10.51
10.58
10.43
10.22
(38.2)bp
(20.7)bp
Investment Yield
7.0
7.3
7.1
7.1
6.7
6.7
(60.8)bp
0.5bp
NIM
4.37
4.51
4.54
4.42
4.34
4.32
(19.1)bp
(2.7)bp
COF
5.23
5.46
5.25
5.38
5.40
5.30
(15.8)bp
(10.5)bp
Spread
5.1
5.1
5.3
5.2
5.0
4.9
(22.4)bp
(10.3)bp
RoA
1.8
1.9
1.95
1.79
2.03
2.29
38bp
26.4bp
RoE
16.4
15.9
16.1
14.6
16.3
18.6
263bp
227.8bp
Exhibit 3: Advance trend
Particulars (` cr)
Q2FY19
Q3FY19
Q4FY19
Q1FY20
Q2FY20
Q3FY20
% YoY
% QoQ
Auto
91,920
93,023
91,383
92,086
90,748
92,205
(0.9)
1.6
Two Wheelers
11,290
11,369
11,271
11,334
11,232
11,255
(1.0)
0.2
CV/CE
49,548
52,880
55,429
55,200
54,272
54,771
3.6
0.9
Sub-total - Auto Loans
1,52,758
1,57,272
1,58,083
1,58,620
1,56,252
1,58,231
0.6
1.3
Personal Loans
84,145
89,550
93,806
97,986
1,02,861
1,10,174
23.0
7.1
Home Loans
47,875
51,799
51,372
55,781
60,029
61,741
19.2
2.9
Business Banking
1,17,039
1,20,429
1,25,014
1,26,099
1,36,578
1,42,599
18.4
4.4
Kisan Gold Card
37,068
36,349
40,362
38,556
40,929
40,916
12.6
(0.0)
Credit Cards
40,535
44,839
46,630
49,523
52,043
57,678
28.6
10.8
Others
21,023
22,403
22,771
22,310
22,824
26,812
19.7
17.5
Gold Loans
5,701
5,760
5,838
5,924
6,086
6,119
6.2
0.5
Loans against securities
3,580
3,455
3,598
3,350
3,252
3,208
(7.1)
(1.4)
Total Retail Advances
5,09,724
5,31,856
5,47,474
5,58,149
5,80,854
6,07,478
14.2
4.6
Corporate & International
2,41,114
2,49,095
2,71,927
2,71,581
3,16,130
3,28,552
31.9
3.9
Total loans
7,50,838
7,80,951
8,19,401
8,29,730
8,96,984
9,36,030
19.9
4.4
Retail
68
68
67
67
65
65
(320.4)bp
14.3bp
Corporate
32
32
33
33
35
35
320.4bp
(14.3)bp
Company, Angel Research
Exhibit 4: GNPA/NPA stable, Bank took contingent provision worth of `700Cr
Particular
Q2FY19
Q3FY19
Q4FY19
Q1FY20
Q2FY20
Q3FY20
% YoY
% QoQ
GNPA
10,098
10,903
11,224
11,769
12,508
13,427
23.2
7.3
GNPA
3,028
3,302
3,215
3,567
3,791
4,468
35.3
17.9
GNPA%
1.33
1.38
1.36
1.40
1.38
1.42
4bp
4bp
NPA%
0.40
0.42
0.39
0.43
0.42
0.48
6bp
6bp
Slippage (%) Annl
2.3
2.0
1.75
2.04
1.66
1.64
(40.8)bp
(1.6)bp
Slippages
4,333
4,000
3,580
4,225
3,714
3,839
(4.0)
3.4
Credit Cost (%)
0.97
1.13
0.92
1.26
1.20
1.30
16.8bp
9.6bp
Provision Calc
69.92
69.57
71.32
69.29
69.57
66.20
(336.8)bp
(336.8)bp
Company, Angel Research
4
HDFC Bank| Q3FY2020 Result Update
Jan 21, 20
4
Outlook & Valuation: Credit growth beat the industry growth rate driven by strong
retail business. The strong liability franchise and healthy capitalisation provides
earnings visibility. We value HDFC Bank using SOTP method, valuing standalone
banking business at 3.7x of FY2021 ABV and its two subsidiaries at `78/share. We
recommend a Hold on the stock, with a target price of `1,390/ share.
Exhibit 5: Valuation Summary
Particulars
%
Valuation
Methodology
Value/share
(`)
Value of HDFC Bank standalone
100
3.7x FY21E ABV
1316
Subsidiaries
HDB Fin
96%
3.5x FY21E ABV
65
HDFC Sec
98%
15x of FY21 PAT
11
Less: Cost of investments
(7)
Fair value per share
1390
Source: Company, Angel Research
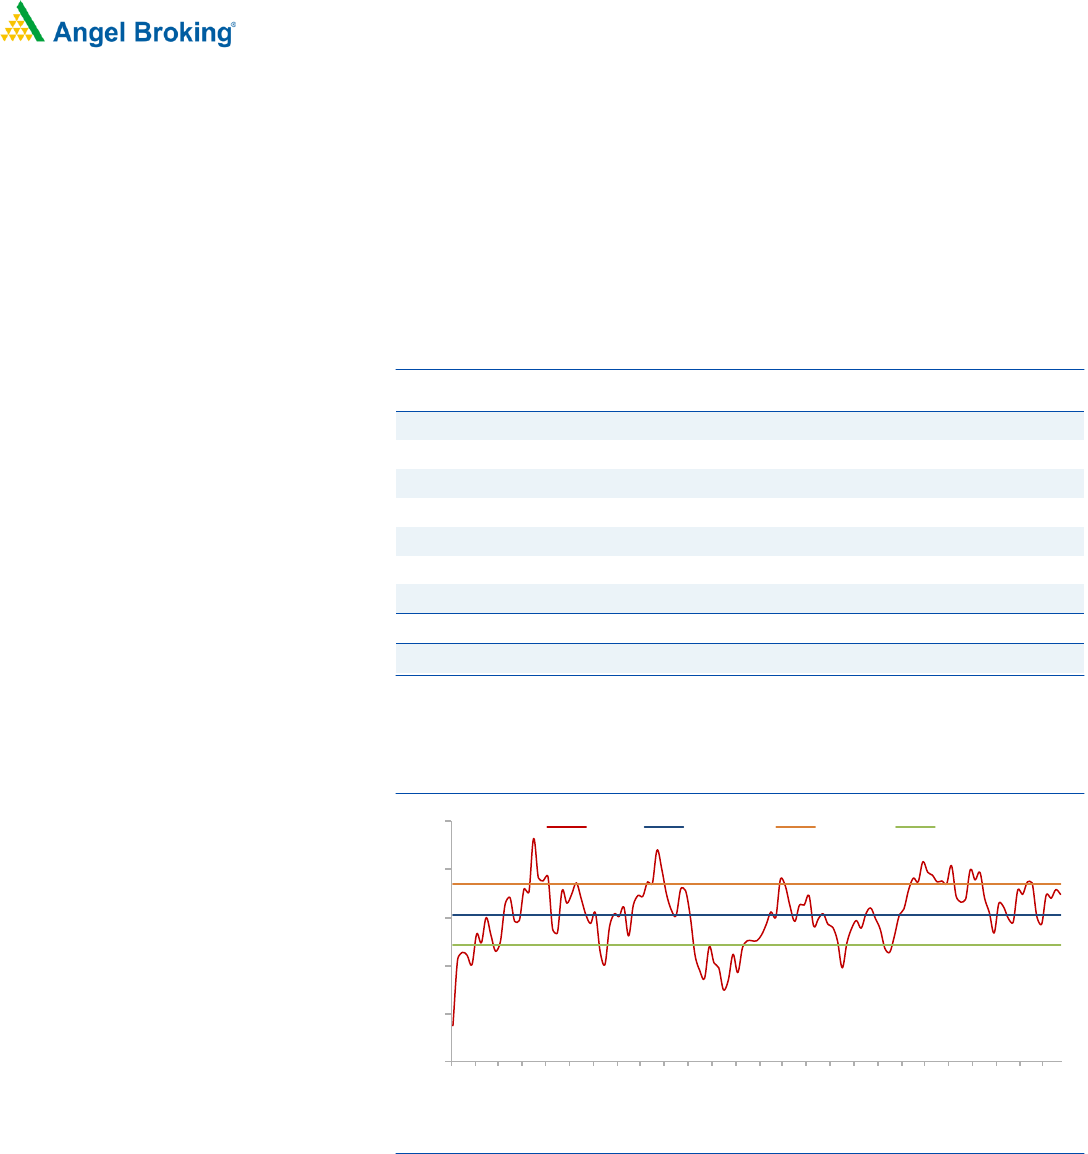
Exhibit 6: One year forward P/BV (x)
Source: Company, Angel Research
3.74
3.53
3.85
3.21
2
2.5
3
3.5
4
4.5
Apr-09
Sep-09
Feb-10
Jul-10
Dec-10
May-11
Oct-11
Mar-12
Aug-12
Jan-13
Jun-13
Nov-13
Apr-14
Sep-14
Feb-15
Jul-15
Dec-15
May-16
Oct-16
Mar-17
Aug-17
Jan-18
Jun-18
Nov-18
Apr-19
Sep-19
P/BV
Avg. P/BV
+1STD
-1STD
5
HDFC Bank| Q3FY2020 Result Update
Jan 21, 20
5
Income Statement (Standalone)
Y/E March (` cr)
FY18
FY19E
FY20E
FY21E
FY22E
Net Interest Income
40,092
48,243
55,893
66,462
79,499
- YoY Growth (%)
21.0
20.3
15.9
18.9
19.6
Other Income
15,221
17,626
23,203
25,870
30,771
- YoY Growth (%)
23.8
15.8
31.6
11.5
18.9
Operating Income
55,313
65,869
79,096
92,333
1,10,270
- YoY Growth (%)
21.7
19.1
20.1
16.7
19.4
Operating Expenses
22,690
26,119
30,806
36,513
43,339
- YoY Growth (%)
15.2
15.1
17.9
18.5
18.7
Pre - Provision Profit
32,623
39,750
48,290
55,819
66,930
- YoY Growth (%)
26.8
21.8
21.5
15.6
19.9
Prov. & Cont.
5,927
7,550
11,554
13,782
16,013
- YoY Growth (%)
65.0
27.4
53.0
19.3
16.2
Profit Before Tax
26,696
32,200
36,736
42,037
50,917
- YoY Growth (%)
20.6
20.6
14.1
14.4
21.1
Prov. for Taxation
9,210
11,122
10,445
10,581
12,816
- as a % of PBT
34.5
34.5
28.4
25.2
25.2
PAT
17,486
21,078
26,291
31,456
38,101
- YoY Growth (%)
20.2
20.5
24.7
19.6
21.1
Balance sheet (Standalone)
Y/E March (` cr)
FY18
FY19E
FY20E
FY21E
FY22E
Share Capital
518
545
548
548
548
Reserves & Surplus
1,05,776
1,43,882
1,70,005
1,95,374
2,26,106
Net Worth
1,06,294
1,44,427
1,70,553
1,95,921
2,26,653
Deposits
7,88,770
9,23,141
11,26,232
13,51,478
16,21,774
- Growth (%)
22.5
17.0
22.0
20.0
20.0
Borrowings
1,23,105
1,17,085
1,01,361
1,35,148
1,62,177
Other Liab & Prov.
45,764
55,108
67,574
81,089
97,306
Total Liabilities
10,63,933
12,39,761
14,65,719
17,63,636
21,07,911
Cash balances
1,04,670
46,764
90,099
94,603
97,306
Bank balances
18,244
34,584
11,262
21,624
25,948
Investments
2,42,200
2,90,588
3,37,870
4,05,443
4,86,532
Advances
6,58,333
8,19,401
9,83,281
11,79,938
14,15,925
- Growth (%)
18.7
24.5
20.0
20.0
20.0
Fixed Assets
3,607
4,030
4,525
8,379
10,055
Other Assets
36,879
44,395
38,683
53,649
72,144
Total Assets
10,63,933
12,39,761
14,65,719
17,63,636
21,07,911
- Growth (%)
23.6
16.5
18.2
20.3
19.5

6
HDFC Bank| Q3FY2020 Result Update
Jan 21, 20
6
Ratio analysis (Standalone)
Y/E March
FY17
FY18
FY19E
FY20E
FY21E
FY22E
Profitability Ratios (%)
NIMs
4.46
4.35
4.36
4.28
4.25
4.27
Cost to Income Ratio
43.4
41.0
39.7
38.9
39.5
39.3
RoA
1.9
1.8
1.8
1.9
1.9
2.0
RoE
18.3
18.2
16.8
16.7
17.2
18.0
B/S ratios (%)
CASA Ratio
48.0
43.5
42.4
45.0
45.0
45.0
Credit/Deposit Ratio
86.2
83.5
88.8
87.3
87.3
87.3
Asset Quality (%)
Gross NPAs
1.1
1.3
1.3
1.4
1.4
1.4
Net NPAs
0.3
0.4
0.4
0.5
0.5
0.4
Slippages
1.5
1.5
2.2
2.0
2.0
2.0
Loan Loss Prov./Avg. Assets
0.6
0.9
0.9
1.2
1.2
1.1
Provision Coverage
69
69
69
66
67
71
Per Share Data (`)
EPS
28.4
33.8
38.7
48.0
57.4
69.6
BVPS
168
205
265
311
358
414
ABVPS
167
204
263
310
356
410
DPS
5.5
6.5
7.5
8.5
9.5
11.5
Valuation Ratios
PER (x)
44.4
37.3
32.6
26.2
21.9
18.1
P/BVPS (x)
7.49
6.14
4.75
4.05
3.52
3.04
P/ABVPS (x)
7.54
6.19
4.78
4.07
3.54
3.08
Dividend Yield
0.4
0.5
0.6
0.7
0.8
0.9
DuPont Analysis (%)
FY17
FY18
FY19E
FY20E
FY21E
FY22E
Interest Income
8.83
8.34
8.59
8.55
8.51
8.57
Interest Expenses
4.61
4.17
4.40
4.42
4.39
4.46
NII
4.22
4.17
4.19
4.13
4.12
4.11
Non Interest Income
1.57
1.58
1.53
1.72
1.60
1.59
Total Revenues
5.79
5.75
5.72
5.85
5.72
5.70
Operating Cost
2.51
2.36
2.27
2.28
2.26
2.24
PPP
3.28
3.39
3.45
3.57
3.46
3.46
Total Provisions
0.46
0.62
0.66
0.85
0.85
0.83
PreTax Profit
2.82
2.77
2.80
2.72
2.60
2.63
Tax
0.97
0.96
0.97
0.77
0.66
0.66
ROA
1.85
1.82
1.83
1.94
1.95
1.97
Leverage
9.88
10.00
9.19
8.59
8.81
9.16
RoE (%)
18.32
18.17
16.81
16.69
17.17
18.03
Valuation done on closing price of 21/01/2020

7
HDFC Bank| Q3FY2020 Result Update
Jan 21, 20
7
Disclosure of Interest Statement HDFC Bank
1. Financial interest of research analyst or Angel or his Associate or his relative No
2. Ownership of 1% or more of the stock by research analyst or Angel or associates or relatives No
3. Served as an officer, director or employee of the company covered under Research No
4. Broking relationship with company covered under Research No
Research Team Tel: 022 - 39357800 E-mail: [email protected] Website: www.angelbroking.com
Angel Broking Limited (hereinafter referred to as “Angel”) is a registered Member of National Stock Exchange of India Limited, Bombay
Stock Exchange Limited, Metropolitan Stock Exchange Limited, Multi Commodity Exchange of India Ltd and National Commodity &
Derivatives Exchange Ltd It is also registered as a Depository Participant with CDSL and Portfolio Manager and Investment Adviser with
SEBI. It also has registration with AMFI as a Mutual Fund Distributor. Angel Broking Limited is a registered entity with SEBI for Research
Analyst in terms of SEBI (Research Analyst) Regulations, 2014 vide registration number INH000000164. Angel or its associates has not
been debarred/ suspended by SEBI or any other regulatory authority for accessing /dealing in securities Market. Angel or its
associates/analyst has not received any compensation / managed or co-managed public offering of securities of the company covered
by Analyst during the past twelve months.
This document is solely for the personal information of the recipient, and must not be singularly used as the basis of any investment
decision. Nothing in this document should be construed as investment or financial advice. Each recipient of this document should
make such investigations as they deem necessary to arrive at an independent evaluation of an investment in the securities of the
companies referred to in this document (including the merits and risks involved), and should consult their own advisors to determine
the merits and risks of such an investment.
Reports based on technical and derivative analysis center on studying charts of a stock's price movement, outstanding positions and
trading volume, as opposed to focusing on a company's fundamentals and, as such, may not match with a report on a company's
fundamentals. Investors are advised to refer the Fundamental and Technical Research Reports available on our website to evaluate the
contrary view, if any
The information in this document has been printed on the basis of publicly available information, internal data and other reliable
sources believed to be true, but we do not represent that it is accurate or complete and it should not be relied on as such, as this
document is for general guidance only. Angel Broking Limited or any of its affiliates/ group companies shall not be in any way
responsible for any loss or damage that may arise to any person from any inadvertent error in the information contained in this report.
Angel Broking Limited has not independently verified all the information contained within this document. Accordingly, we cannot testify,
nor make any representation or warranty, express or implied, to the accuracy, contents or data contained within this document. While
Angel Broking Limited endeavors to update on a reasonable basis the information discussed in this material, there may be regulatory,
compliance, or other reasons that prevent us from doing so.
This document is being supplied to you solely for your information, and its contents, information or data may not be reproduced,
redistributed or passed on, directly or indirectly.
Neither Angel Broking Limited, nor its directors, employees or affiliates shall be liable for any loss or damage that may arise from or in
connection with the use of this information.
Ratings (Based on Expected Returns: Buy (> 15%) Accumulate (5% to 15%) Neutral (-5 to 5%)
over 12 months investment period) Reduce (-5% to -15%) Sell (< -15%)
Hold (Fresh purchase not recommended)
Note: We have not considered any Exposure below
`
1 lakh for Angel, its Group companies and Directors